This is Daily Golden Nugget part-2 explaining how to read your Google "My Business Insights." Take a look at yesterday's Nugget to get up to speed before reading this one.
Insights Engagement Reports
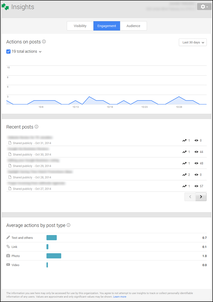
Here's a screen shot of the Insights Engagement report:
(click to enlarge)
Even though the above report does not show much data, this is probably the level of activity you'd see on your own report if you posted to Google+ at least once per day.
Actions on posts
As the name implies, the Actions on Posts report shows the types of engagements that people had with your Google+ posts. Let me be very clear on that point... This report will be blank if you are not posting to Google+.
Clicking on the chevron will reveal the individual breakdowns of each action as shown here:
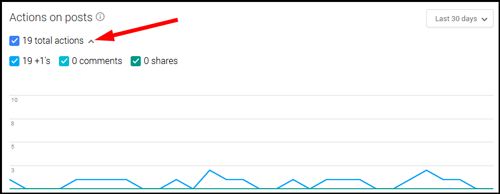
The above example only shows 19 times that people have clicked the +1 button on Google+. Over the last 30 days, no one commented, or shared any of the posts.
Recent posts
The recent post report shows the number of times people have clicked the +1 button on a post and the number of times that people have viewed the post.
Take a close look at this screen shot:
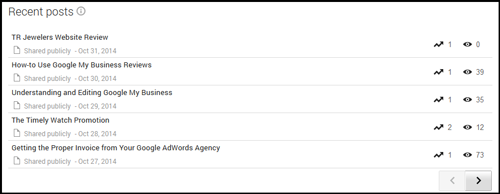
The first item in the report show that it has a single +1 but zero views. Although this seems like an anomaly, what's really happened here is that someone clicked the +1 button from their Google+ stream without clicking in to view the full post.
This scenario will happen quite often as you share content, especially when you can read the full post in the Google+ stream. A view will only get counted when someone clicks into your post.
You can click the titles of the posts shown in that report to see more detail like this:
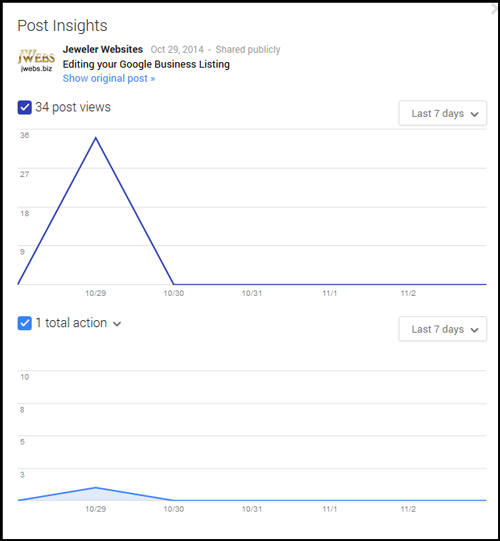
The reporting period can be adjusted to see the first 72 hours, 7 days, 30 days, or 90 days.
Average actions by post type
The last report on the Engagement screen shows the all-time average actions broken down by post type. Hovering over each type brings up the view you see here:
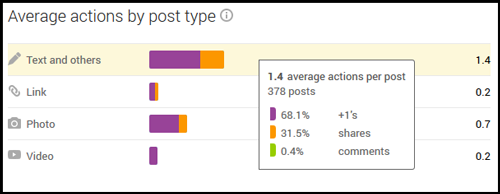
In the sample report above, you see that there were 378 text posts. On average, it's 68.1% of them that get +1's and 31.5% that get reshared. Only 0.4% of them receive comments.
It's this report that shows you what your audience likes. Use this as your guide for creating future content that will be more likable by your audience.
Speaking of audience...
Audience
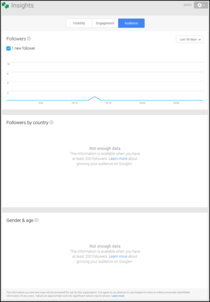
The last My Business Insights screen has information about your audience. You access the screen by clicking the Audience button on the top of the Insights screen.
This is what it looks like:
(click to view larger)
The sample report I'm showing above only has 1 new follower and then there's no data showing for the Followers by Country or Gender & Age. As a retail jeweler, you'll probably see similar blank reports unless you have thousands of Google+ interactions.
Don't fret by the lack of information here. This is only reporting on your Google+ account. You can find a lot more country, age, and gender information in the Google Analytics reports for your website.
Final Thoughts
The data reported in My Business Insights only reflects how the world engages with your Google+ page. There will always be some data collected in these reports, even if you don't use your My Business account or Google+. Those who use Google+ all the time will certainly see these numbers increase over time.
When posting to Google+ you will help increase the organic ranking of your website while also increasing social engagement through Google+. It's that social engagement that My Business Insights reports on.
Although this is the part-2 of Insights, this is actually part-5 of a longer series on Google My Business. Here's the links to the first 4 Nuggets in this series:
1. Basic orientation of Google My Business
2. Editing your information in My Business
3. Reading and replying to Google Reviews
4. Google My Business: Insights Reports - Part 1


