With the 2015 Holiday Season at an end, let's take a look at some website tracking results from the Thanksgiving week through Christmas.
I have a lot of data to from various retail jeweler websites. The set of data I'm referencing below was recorded across retail jewelry websites that have been active with updating their website regularly over the last 12 months. These same websites are also mobile friendly. This includes a combination of retail jewelers and ecommerce sites. Remember, the results shown here only apply to the jewelry industry.
Holiday 2015 Sessions
Here's a screen shot of my Google Analytics tracking across the retail jewelry websites I'm tracking:

(click to enlarge)
The blue line shows the number of sessions for 2015 and the orange line shows sessions for 2014. The dip in sessions on Thanksgiving and Christmas always seem to maintain consistent patterns; however this year, the website traffic for the 6 days leading up to Christmas was 29.41% lower than in 2014.
There was an increase of 12.47% in visitor traffic between Thanksgiving and that final weekend before Christmas. The Saturday before Christmas is often referred to as Super Saturday, but it wasn't so super for website traffic. I don't have access to in-store sales figures, so if you're interested, please check your sales data and let me know if your sales were up, down, or the same, and by what percentage for that last weekend before Christmas. I'll be sure to write a follow-up to this Nugget if I can get some real sales data returned.
Notice the steady increase in visitor sessions after Thanksgiving. That's the typical website traffic pattern every year. It also corresponds to the increase in cost for online paid advertising during the same period.
Holiday 2015 Desktop vs. Mobile
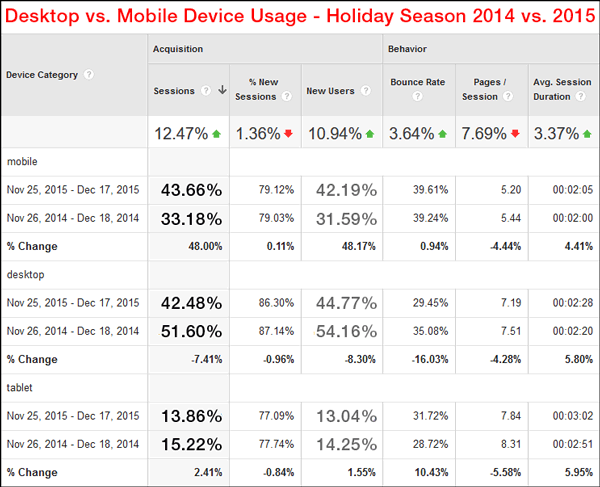
I pulled this next chart from the Audience > Mobile > Overview report of Google Analytics. It shows the huge difference in how people are using their smartphones, desktops, and tablets during the holiday season. Take a look:

The reporting period was from Thanksgiving through Super Saturday. As I mentioned above, there's an overall 12.47% increase in session count for this period. The other percentage numbers you see above are the individual breakouts for each device group.
For 2015, mobile traffic accounted for 43.66% of all sessions, desktop traffic was 42.48% and tablet traffic was the remaining 13.86%. Mobile traffic from 2014 increased greatly while desktop traffic dropped.
As expected for the 2015 holiday season, desktop traffic dropped below 50% and the combined mobile and tablet device traffic rose to 57.52%. As I said last week, 2015 was finally the year of mobile.
Overall, the bounce rate and average session durations were better in 2015 than 2014. I have to assume that this is due in part to the updates and active attention given to making improvements to the websites measured in this sample set.
Conclusions
The final takeaway from today's Daily Golden Nugget is that mobile websites are important. As of this writing, the majority of all retail jewelry websites I look at are still not mobile friendly, nor are they being updated on a regular basis. Now that 2016 is here, you need to either commit to your mobile efforts or you need to quit and go home.


