In this edition of #ThrowbackThursday, I'm jumping back to a year ago to the last time I updated my report on the most popular smartphone resolutions used by visitors to retail jewelry websites.
The last time I reviewed smartphone screen resolutions was only a week after the iPhone 6 had been released. For several years, the iPhone has been the most popular smartphone choice for jewelry buyers. All my data is collected from jewelry websites, and I imagine a similar data set for an electronics store would look much different.
It doesn't matter if you prefer the iPhone or one of the Android phones; that's a personal choice. My choice is the iPhone. I use the Android and iPhone every day to analyze websites, but my instinct is to always grab the iPhone when I need to use a mobile device.
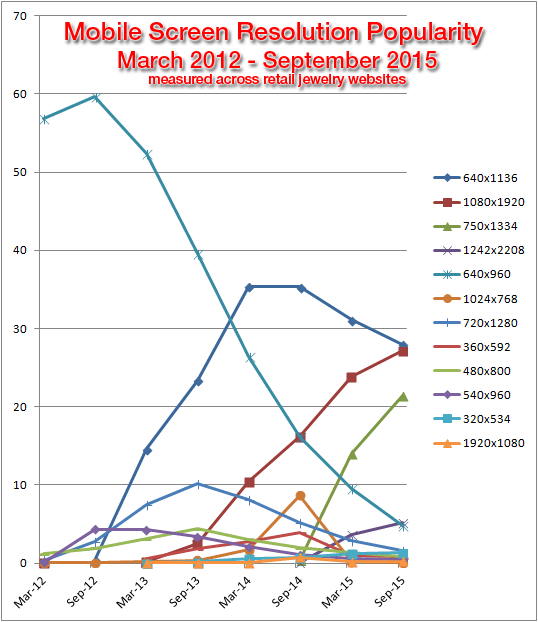
This chart shows the mobile screen resolution popularity over the period March 2012 - September 2015:
 ]
]A Note For Programmers: I've adjusted the data in this chart to show the full resolution for newer devices instead of the CSS pixel ration that might be reported. It always seems odd to me when I refer to the newer smartphones with old fashion sounding pixel resolutions, so I just corrected the data to make more sense for business owners.
Here's the breakdown of the resolution and the cross referencing smartphones:
| Screen Resolution | Smartphone Type | Reported Resolution |
| 640x1136 | iPhone 5, 5C, 5S, iPod Touch 5g | 320x568 |
| 1080x1920 | Galaxy SIII - S6, Galaxy Note II - 4 | 360x640 |
| 750x1334 | iPhone 6, 6s | 375x667 |
| 1242x2208 | iPhone 6 Plus, 6s Plus | 414x736 |
| 640x960 | iPhone 3, 4 | 320x480 |
| 1024x768 | iPad 2, iPad Mini | n/a |
| 720x1280 | Galaxy SIII, Galaxy Note II | n/a |
| 360x592 | Sony, Motorola, Nexus | n/a |
| 480x800 | Galaxy SII, SIII | n/a |
| 540x960 | Galaxy S4, Razr 4G | n/a |
| 320x534 | Galaxy S, Galaxy Ace | n/a |
| 1920x1080 | Galaxy S5 | n/a |
In the month of September 2015, iPhone users accounted for 59.39% of all sessions to jewelry store websites. That's up 7.38% from one year ago.
iPhone 6 adoption rates jumped from nothing to 21.4% in just one year. The iPhone 6 Plus went from zero to 5.18%. Notice how the iPhone 5 is slowly declining in popularity while the iPhone 3 and 4 usage plummeted over the last 12 months. I interpret this to mean the iPhone 3 and 4 users upgraded to the iPhone 6, while iPhone 5x users are either stuck in their contracts, or simply prefer the smaller format of the 5x device.
Here's a tabular report of the smartphone usage recorded during September 2015:
| Screen Resolution Mobile | Device Name | % Sessions |
| 320x568 | Apple iPhone 5x | 28.01% |
| 375x667 | Apple iPhone 6x | 21.40% |
| 360x640 | Samsung Galaxy S5 | 5.31% |
| 414x736 | Apple iPhone 6x Plus | 5.18% |
| 320x480 | Apple iPhone 3x & 4x | 4.51% |
| 360x640 | Nexus, HTC | 2.47% |
| 360x640 | Samsung Galaxy Note 4 | 1.98% |
| 360x640 | Samsung Galaxy S4 | 1.73% |
| 360x640 | Samsung Galaxy S6 | .66% |
| 360x640 | Samsung Galaxy S IV | .24% |
| 360x640 | Samsung Galaxy S5 | 1.21% |
| 720x1280 | Samsung Galaxy S III | .04% |
| 360x640 | Samsung Galaxy S6 Edge | 1.02% |
| 360x640 | Samsung Galaxy Note 3 | 0.90% |
| 360x640 | Sony Ultra | 0.82% |
| 360x640 | Motorola Droid Turbo | 0.64% |
| 320x534 | LG G3 | 0.54% |
| 360x640 | Samsung Galaxy S4 | 0.45% |
| 1366x768 | Microsoft Surface | 0.42% |
The Samsung Galaxy products appear a lot in the table, but they only account for 16.54% of the user sessions in September 2015, whereas the Apple iPhone 6x already achieved 21.40% in just one year.
The next time you upgrade your website, make sure that it will correctly support these smartphones. The next time you upgrade your smartphone, you might also want to choose from one of the popular models listed here so you can experience the mobile web the same way your customers do.


