The web browser wars rage on. Internet Explorer, Chrome, Firefox, Safari... Which one do you use?
It's time to check in again on the current state of affairs of website browsers usage. Since I started tracking this data several years ago, I've been surprised with the popularity growth and decline of my personal favorite web browsers. The informed internet user will use the web browser they like the most, downloading it from whatever default browser they start with. On the other hand, there's an entire group of people who just use whatever web browser is built in and appears as that default for their operating system.
A note about the following charts: The percentages shown here are relative to one another for all three device types. The total percentages shown in all three charts equate to ~100%, with a 0.1% rounding error.
Desktop Browser Usage
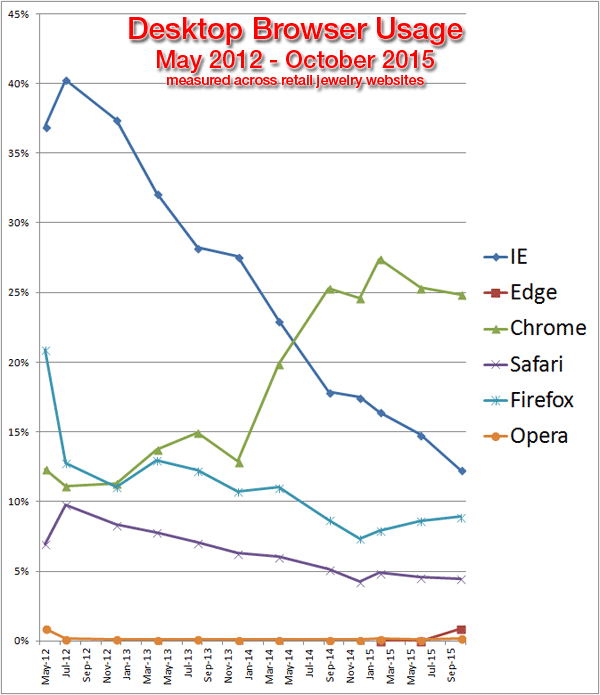
Here's the current trend for desktop web browsers measured across retail jewelry websites in the USA from May 2012 through October 2015:

The new kid on the block is Edge. This is Microsoft's new web browser that launched with Windows 10. This browser will ultimately replace Internet Explorer. Edge is Microsoft's attempt at creating a web browser that follows the internationally agreed upon, and standardized, functionality of web browsers. Microsoft hopes it will compete with Chrome and Firefox, which are already built to follow the standards. They will continue to support and make new versions of Internet Explorer for backwards compatibility, but Edge will not support any of the proprietary Microsoft technology built into IE, like ActiveX.
My go-to web browser is Firefox. I use that one simply because I have a lot of development extensions that make my daily job easier. Although, most of the work day, I have Chrome and Firefox open side-by-side.
Which is your favorite?
Here's the table of data for your review:
| Oct-15 | Jun-15 | Feb-15 | Dec-14 | Sep-14 | Apr-14 | Dec-13 | Aug-13 | Apr-13 | Dec-12 | Jul-12 | May-12 | |
| IE | 12.29% | 14.81% | 16.43% | .52% | 17.88% | 22.99% | 27.58% | 28.22% | 32.14% | 37.41% | 40.28% | 36.95% |
| Edge | 0.88% | 0.00% | 0% | 0% | 0% | 0% | 0% | 0% | 0% | 0% | 0% | 0% |
| Chrome | 24.87% | 25.34% | 27.39% | 24.58% | 25.31% | 19.87% | 12.87% | 14.93% | 13.73% | 11.32% | 11.09% | 12.33% |
| Safari | 4.49% | 4.56% | 4.88% | 4.25% | 5.15% | 6.03% | 6.29% | 7.09% | 7.81% | 8.34% | 9.79% | 6.97% |
| Firefox | 8.90% | 8.62% | 7.91% | 7.36% | 8.68% | 11.02% | 10.74% | 12.23% | 12.94% | 11.04% | 12.77% | 20.87% |
| Opera | 0.18% | 0.09% | 0.15% | 0.11% | 0.11% | 0.10% | 0.10% | 0.12% | 0.11% | 0.12% | 0.17% | 0.88% |
Mobile Browser Usage
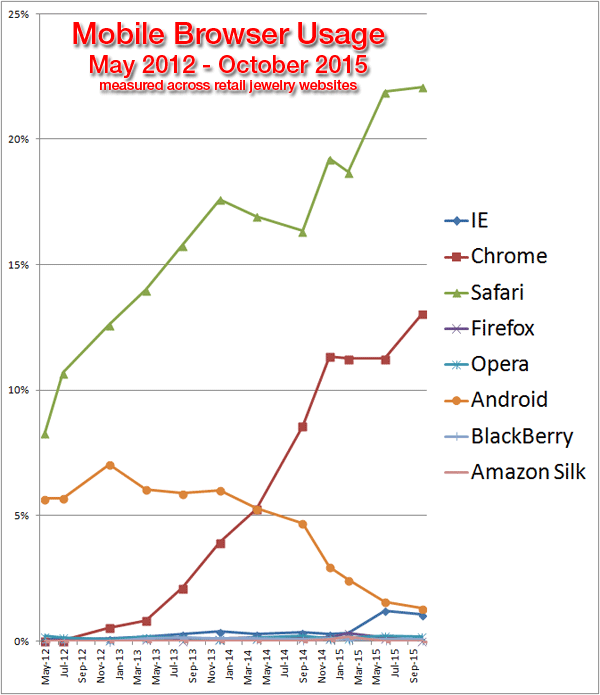
Here's the current trend for mobile web browsers measured across retail jewelry websites in the USA from May 2012 through October 2015:

The popularity of Apple products is easy to see in the above table. Unlike the desktop users who install their preferred browser instead of using the default IE and Edge; in the smartphone world, the iPhone users are satisfied with the built-in Safari browser.
The Android browser was once the default installation on all Android smartphones, but that's been replaced with Chrome as the default.
The Apple iOS and Google Android mobile operating systems allow you to install a different browser, but obviously most people don't.
Here's the table of data for your review:
| Oct-15 | Jun-15 | Feb-15 | Dec-14 | Sep-14 | Apr-14 | Dec-13 | Aug-13 | Apr-13 | Dec-12 | Jul-12 | May-12 | |
| IE | 1.06% | 1.22% | 0.31% | 0.28% | 0.35% | 0.28% | 0.38% | 0.27% | 0.17% | 0.11% | 0.08% | 0.08% |
| Chrome | 13.05% | 11.27% | 11.25% | 11.35% | 8.58% | 5.27% | 3.94% | 2.13% | 0.83% | 0.54% | 0.02% | 0.00% |
| Safari | 22.08% | 21.89% | 18.69% | 19.23% | 16.35% | 16.94% | 17.61% | 15.78% | 13.99% | 12.61% | 10.70% | 8.30% |
| Firefox | 0.01% | 0.14% | 0.33% | 0.12% | 0.12% | 0.13% | 0.10% | 0.04% | 0.08% | 0.04% | 0.03% | 0.01% |
| Opera | 0.18% | 0.22% | 0.14% | 0.12% | 0.20% | 0.12% | 0.08% | 0.15% | 0.16% | 0.07% | 0.15% | 0.21% |
| Android | 1.31% | 1.57% | 2.43% | 2.95% | 4.70% | 5.29% | 6.01% | 5.89% | 6.04% | 7.04% | 5.69% | 5.68% |
| BlackBerry | 0.06% | 0.08% | 0.07% | 0.09% | 0.08% | 0.11% | 0.10% | 0.13% | 0.11% | 0.00% | 0.00% | 0.00% |
| Amazon Silk | 0.01% | 0.01% | 0.16% | 0.06% | 0.00% | 0.00% | 0.00% | 0.00% | 0.00% | 0.00% | 0.00% | 0.00% |
Tablet Browser Usage
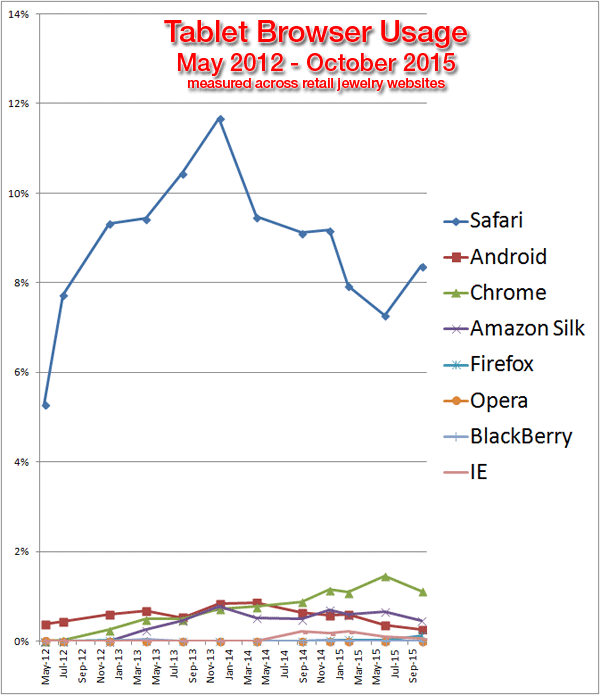
Here's the current trend for tablet web browsers measured across retail jewelry websites in the USA from May 2012 through October 2015:

The Apple iPad continues to dominate the market. No matter how many companies try to develop an Android tablet, they just can't seem to compete. Like the smartphones, tablet users don't usually install other browsers than the default Safari and Chrome.
I do have to point out that my data is specific for the jewelry industry. The data always shows that Apple product owners seem to have a higher interest in fine jewelry than Android users.
Here's the specific data for your review:
| Oct-15 | Jun-15 | Feb-15 | Dec-14 | Sep-14 | Apr-14 | Dec-13 | Aug-13 | Apr-13 | Dec-12 | Jul-12 | May-12 | |
| Safari | 8.38% | 7.27% | 7.93% | 9.18% | 9.12% | 9.47% | 11.67% | 10.45% | 9.44% | 9.32% | 7.74% | 5.29% |
| Android | 0.26% | 0.36% | 0.59% | 0.58% | 0.64% | 0.86% | 0.84% | 0.53% | 0.67% | 0.59% | 0.43% | 0.37% |
| Chrome | 1.12% | 1.45% | 1.09% | 1.15% | 0.89% | 0.77% | 0.72% | 0.49% | 0.49% | 0.25% | 0.02% | 0.00% |
| Amazon Silk | 0.46% | 0.66% | 0.59% | 0.70% | 0.49% | 0.52% | 0.78% | 0.47% | 0.25% | 0.00% | 0.00% | 0.00% |
| Firefox | 0.13% | 0.02% | 0.03% | 0.02% | 0.00% | 0.00% | 0.00% | 0.00% | 0.00% | 0.01% | 0.00% | 0.00% |
| Opera | 0.00% | 0.00% | 0.00% | 0.00% | 0.00% | 0.00% | 0.00% | 0.00% | 0.00% | 0.00% | 0.00% | 0.01% |
| BlackBerry | 0.00% | 0.00% | 0.00% | 0.01% | 0.00% | 0.00% | 0.00% | 0.00% | 0.03% | 0.00% | 0.00% | 0.00% |
| IE | 0.06% | 0.11% | 0.21% | 0.18% | 0.21% | 0.00% | 0.00% | 0.00% | 0.00% | 0.00% | 0.00% | 0.00% |
Conclusions
As always, I provide this data to help guide the entire retail jewelry industry as they develop their latest website.
Remember that the 3 above charts are all related to one another. As of this writing, the most popular browser is the Chrome on the Desktop with 24.87% usage. The second most popular browser is Safari on Smartphones with 22.08% usage.
It's easy to see, sometime very soon, more people will be using their smartphones every day to browse the web than their desktop computers.
Is your website mobile compliant?


