After all the time and money you spend on your website, wouldn't it be nice to know how much people like it, or how much time they spend on it?
There's a simple report inside Google Analytics, called the Audience Engagement report, that will tell you exactly that.
Log into your Google Analytics account and click on Audience -> Behavior -> Engagement as shown here:

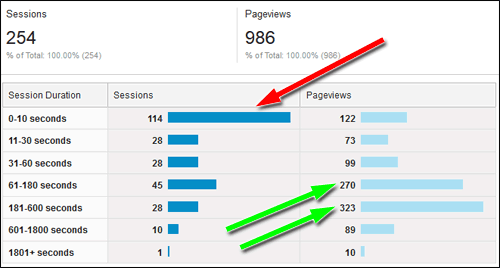
This is how the report looks for a typical retail jewelry store over a 1-week period:

The report breaks out all your website visitors into the groups based on the number of seconds they stayed on your website. Normally the lowest grouping of "1-10 seconds" will show the most number of Sessions. Meanwhile, the visitors in the 61 seconds through 600 seconds category will have the highest number of page views.
Although I often use the terms Sessions and Visitors interchangeably, they really are different. Google Analytics measures the amount of time a single person spends on your website. They count a session as any duration of consecutive activity on your site. The session concludes if they have been inactive for more than 30 minutes. It's easy to count a single person for 2 sessions if they take a lunch break or a grab a coffee while browsing your site.
The term Pageviews refers to the number of pages someone looks at during their session; however, on this report it refers to the total number of pages the whole group looked at.
The reason the 1-10 seconds group is high is simply because all of your bounced users are included in there. This particular website has a bounce rate of 41.73%, which equates to 106 bounced users. The report shows 114 users that stayed less than 10 seconds. That tells me there were 8 users who clicked a link within a few seconds of landing on the site and viewed a second page.
The 1-10 group also includes all those people who stayed on 1 page of your website for a long time; perhaps reading one of your blog posts. Unfortunately, Google Analytics doesn't measure these blog reading people without a little extra work.
It's the users in the "61-180 seconds" and the "181-600 seconds" groupings that will visit the greatest number of pages on your site. Feel free to use this as a benchmark for how your own website should be performing.
If your website doesn't have similar bar charts like what you see here, then it's time to do some testing and figure out where the problem is. You probably need a website redesign.
True Engagement Measurements
The report shown above is how it would look if you use the standard Google Analytics setup.

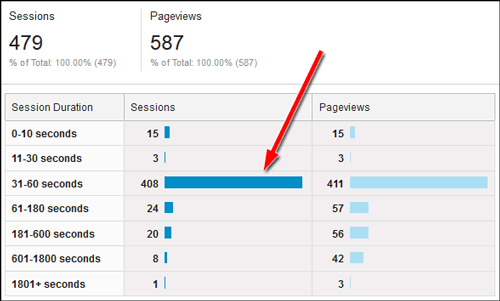
This particular Audience Engagement report is a snapshot from my own jwag.biz website. As you can see, the 1-10 seconds group has only 15 people and most of the visitors are in the 31-60 second group.
Most visitors to the jWAG site only read a single post. Very few people browse around. A few years ago all of my visitor traffic was skewed into the 1-10 second group because Google Analytics couldn't correctly track how long people were reading. My bounce rate was also near 90%.
In order to correct my reports and create more actionable data, I slightly changed my Google Analytics tracking code similar to what you see here:
ga('create', 'UA-xxxxxxx-1', 'auto');
ga('send', 'pageview');
setTimeout("ga('send','event','Engagement','time on page hit 50 seconds')",50000);
ga('send', 'pageview');
setTimeout("ga('send','event','Engagement','time on page hit 50 seconds')",50000);
With this modification, GA is now able to track when someone sits on a page for 50 seconds or more. That's why the above report shows 408 sessions in the 31-60 seconds group.
I know that people take longer than 50 seconds to read a single Daily Nugget, so I could further modify it to look like this:
ga('create', 'UA-xxxxxxx-1', 'auto');
ga('send', 'pageview');
setTimeout("ga('send','event','Engagement','time on page hit 50 seconds')",50000);
setTimeout("ga('send','event','Engagement','time on page hit 80 seconds')",80000);
setTimeout("ga('send','event','Engagement','time on page hit 185 seconds')",185000);
ga('send', 'pageview');
setTimeout("ga('send','event','Engagement','time on page hit 50 seconds')",50000);
setTimeout("ga('send','event','Engagement','time on page hit 80 seconds')",80000);
setTimeout("ga('send','event','Engagement','time on page hit 185 seconds')",185000);
Then I'd be able to track if they stayed 50 second, 80 second, or 185 seconds.
Feel free to make the same modifications to your own Analytics account; these changes won't harm any of your reports and they will add more value to the results you see in this Engagement report.


