With the 2014 Holiday Season at an end, let's take a look at some website tracking results from the Thanksgiving week through Christmas.
The following data was recorded through more than 100 jewelry related websites. This includes a combination of retail jewelers and e-commerce sites. Results shown here only apply to the jewelry industry.
Holiday 2014 Sessions
Here's a screen shot of my Google Analytics tracking across the retail jewelry websites I'm tracking:

(click to enlarge)
The blue line shows the number of sessions for 2014 and the orange line shows sessions for 2013. The dip in sessions on Thanksgiving and Christmas always seem to maintain consistent patterns.
There was an 18.1% increase in sessions in 2014 over 2013, which is represented by the blue line being higher on the chart than the orange.
The number of sessions steadily increased every week from Thanksgiving through Christmas, which is actually a similar repeating pattern every year.
Compare this data to your own from 2013 and 2014 and keep it all handy when you are planning your advertising for Q4 of 2015.
Holiday 2014 Desktop vs. Mobile
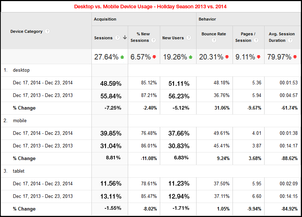
I pulled this next chart together manually from different reports in Google Analytics. It shows the difference of desktop, smartphone, and tablet users from 2013 and 2014.
I've narrowed the time period to the 7 days preceding Christmas, which represents when users are more rushed, and therefore more likely to use their smartphone for searching.

(click to enlarge)
The overall number of sessions for those 7 days right before Christmas increased by 27.64% from 2013 to 2014. The percentage of smartphone users jumped 8.81% while desktop and tablet usage both dropped.
Overall, we also saw a 19.26% increase in the number of new users during those last 7 days. This tells me that last minute shoppers were willing to try a new retail store during the holiday crunch time. Again we see that the smartphone usage increased by 6.83% while the desktop and tablet usage lost users.
Even though the session numbers are all heading in the right direction, the Bounce Rate, Pages per Session, and Average Session Duration are all heading in a bad direction.
I've been noticing that the bounce rates on all websites I'm tracking has increased over the last 12 months. Since this bounce rate increase seems to be an industry wide phenomenon, rather than related to website design or usability, I've attributed the change to the way Google and Bing are displaying search results. In that, search results are better at showing website pages that better match the search queries.
When search engines show better results, users are more likely to find what they are looking for on the first, and only, page they visit. Even though they find what they are looking for, that one-page visit counts as a "bounce."
The same attribution theory I mentioned for bounce rates, also applies to the drop in the Pages per Session.
On the other hand, there's a humongous drop in the Average Session Duration from 2013 to 2014. Most of that change took place with smartphone and tablet users. My attribution theory on this one is two-fold. First, Google mobile search results are a lot better in 2014 than 2013, so mobile users are able to zero in on their needs with only 1 or 2 taps. The second reason could be the result of more users on the faster 4G network or wifi hotspots. Slower devices on slower wireless networks would certainly account for the 14 minute average session durations in 2013.
The best Nugget to take away from the desktop and mobile device usage is that your website needs a mobile version that's easy to use, and it must contain all the same information as your desktop site.


