Here are the website tracking statistics from mid-November through mid-December 2014. As usual, these results are pulled from the group of 100+ retail jewelry websites that I monitor and the results might not apply to any other industry.
4-Weeks of Holiday Data
Here's the graphical representation of the sessions I've been tracking:

Although the weeks leading up to Thanksgiving showed a large increase in website sessions, the user patterns since Thanksgiving have followed 2013 very closely to last year's pattern with only a 12% increase.
Although that 12% probably does not translate into 12% more foot traffic or 12% higher sales, I do expect that we'll be hearing about slightly increased sales from retail jewelers.
Are your own sales up?
New vs. Returning Visitors
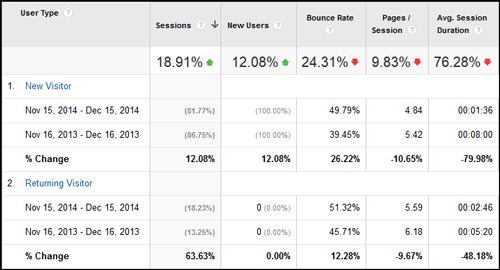
This next table shows the trends of the visitors who have never been to a site before compared to the people who are returning again for 2 or more times.

Overall, the number of sessions is up by 18.91% from the same period last year. Although the number of new users is up 12.08%, the number of returning visitors is 63.6% higher than last year.
That higher return visitor count could be the result of better website content, better Google matching of websites to search terms, or a combination of both. I'd like to clarify that the "better matching of search terms" does NOT mean the websites had higher ranking. Google has made a lot of advancements over the last 12 months, advancements which are better able to return the right results for search queries even if the website hasn't been updated.
On the other hand, the results for Bounce Rate, Pages Viewed, and Session Duration all got worse. So even though there are more people seeing these sites, they are engaging far less than last year.
You should consider some A/B testing and a website redesign if you see lower sessions, durations, and increased bounce rate like this on your own site.
Visitor Age
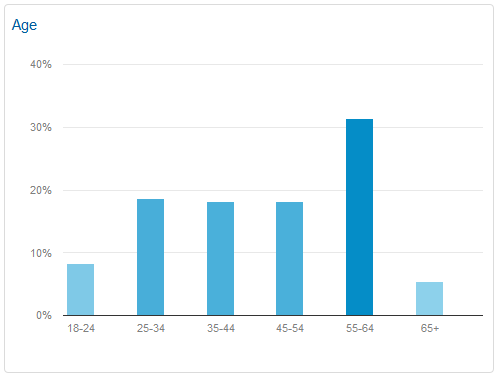
According to this chart, it's the 55-64 age range that's most interested in visiting a jewelry website during this holiday season.

You can find this report in your own Google Analytics under Audience -> Demographics -> Age.
Take a look at your own age group demographics to help you formulate appropriate advertising for next year. If possible, cross reference this to your own customer sales figured sorted by age group. You just might discover that your ads will resonate a lot more if your models are a little older.
Acquisition Channels
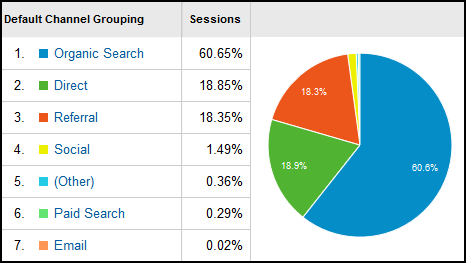
The last data review for today is the acquisition channels. This should be especially important for all of you spending a lot of time and money on your Facebook social sharing.

According to the above chart, organic traffic accounts for more than 60% of website visitors while the social traffic is less than 1.5%. It's important to note that all the jewelers in this sample data set have active Facebook accounts, yet all that effort doesn't convert into website traffic.
That's not to say that Facebook is useless; you just need to set up a conversion channel that leads those Facebook users to a point of purchase.
The direct traffic of 18.8% means that those visitors typed in the domain name directly into their web browser.
The 18.3% of referral traffic comes from site like TheKnot.com, YellowPages.com, and various jewelry designer websites.
Every marketing channel has a method of converting people into customers; this report only shows if those people are visiting your website first.
I'll be back with more data after the 2014 Holiday season concludes.


