Here are the website tracking statistics from Thanksgiving Day through Cyber Monday in 2014. As usual, these results are pulled from the group of 100+ retail jewelry websites that I monitor and the results might not apply to any other industry.
November 2014 Sessions
Let's first take a look at this chart from Google Analytics:

The orange line shows the number of website sessions in November 2013 and the blue line shows the number of website sessions in November 2014. I've aligned the chart so Thanksgiving of both years lines up.
What you see there is a average 25.98% increase in website "sessions" for the entire month of November 2014 over November 2013. Just to be clear, a website session is a single visit to a website. The same person might visit a website several times, counting as a new session each time.
Wednesdays in November 2014
I'd like to point out that the first three Wednesdays in November had an impressive 56.5%, 52.18%, and 45.54% increases respectively. For the website I'm tracking, I know these increases have nothing to do with changes in online marketing strategies. This is simply the growth of customer usage of the internet.
2014 Thanksgiving Weekend
Although November showed amazing growth overall, the Thanksgiving through Cyber Monday weekend only had a 9.18% growth over last year. The biggest growth day was Thanksgiving with 21.42% more website sessions.
The Need for Earlier Updates
I really would like to emphasize how these growth patterns need to influence the way you plan for the holiday season. Clearly there are more people browsing your website throughout November, which includes about a 1% increase in the number of jewelry product catalog pages that were viewed.
There was a 5.96% increase in the number of people viewing the store hours throughout the month of November, and even more specific there was an increase of 28.95% in the number of people specifically looking for store hours over the long Thanksgiving weekend.
I'm emphasizing the situation with the store hours because I know many retail jewelry stores don't update their holiday store hours until after Thanksgiving. This shows a clear need to update those hours much earlier than you ever have in the past.
Thanksgiving Weekend Home Page Views
Now take a look at this chart of the number of home page views:

Again, the orange line shows the long Thanksgiving weekend from 2013 and the blue line shows the 2014 long Thanksgiving weekend. On average, the number of pageviews of the home page increased by 267.85% for the long weekend, but that number is not as impressive as the "Entrances" to the home page.
Google Analytics reports a website "entrance" as the first page a visitor sees when they arrive on your website. Most website owners do expect that their home page is the first page someone will see. Although that makes sense, in reality there are many times when Google offers a different page in search results other than the home page. These entrance pages are also known as "landing pages."
Over the long Thanksgiving weekend I tracked a 571.48% increase in the home page entrances! This significant rise correlates with a deeper trend that I've been noticing with Google. I've noticed that, when Google is delivering location based results for retail stores, the SERP is ranking entire websites according to their overall online footprint, rather than individual pages. Websites with large online catalogs, many published blogs, and active social accounts are appearing with a link to the home page rather than an individual blog page or item in the catalog.
By extension, if this trend continues, it's not important any more to worry about the amount of words written on your home page because your online body of work supports it. Instead, it's more important to concentrate on usability and sensible navigation from your home page to deeper areas of your site.
Thanksgiving Weekend Mobile vs. Desktop
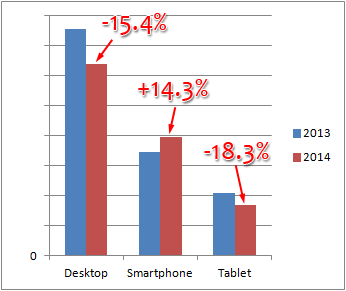
As expected, the amount of smartphone traffic has increased while desktop traffic decreased as shown here:

From 2013 to 2014, desktop traffic decreased 15.4%, smartphone traffic increased 14.3%, and tablet traffic decreased 18.3%.
As smartphones become larger, it makes sense that the tablet traffic would also decrease since many people simply replaced their tablet with a new smartphone.
As Compared to News Reports
Before I started writing this Nugget today, I read through the news reports from Bloomburg, ABC News, and Business Insider. The general consensus from those three sources was that the sales from this past weekend were flat as compared to last year, but they also reported higher sales throughout the earlier weeks in November.
Their reports certainly correlate with the first chart I showed above, which shows a similar amount of weekend traffic but a greater amount through the earlier weeks.
The growing sales throughout November also correlate to the higher number of Black Friday emails that I reported in yesterday's Nugget.
The data seems to support the overall reports that the importance of Black Friday is diminishing. Sales are available earlier and the ability of 24/7 online ordering nullifies the need to rush to the stores on Thanksgiving evening and Black Friday for the best deals.
Black Friday Arrives In Europe
The last point I'd like to mention today is the appearance of Black Friday sales in the UK and France this year. I was quite surprised to see Black Friday sales mentioned at the local shopping mall here in Bordeaux, France this year.
Additionally, my friends in the UK and France had mixed feelings about "American commercialism" infiltrating their economy.
Perhaps the diminishing importance of Black Friday will quell further spread of Black Friday sales throughout Europe.
Time will tell.


