What role will smartphones play in the lives of the everyday average consumer during the 2014 holidays? The mobile audience is becoming more important in marketing as mobile devices become more ubiquitous in everyone's daily lives.
Everyone has a different opinion of which smartphones are better. Many software developers prefer the Android devices because they provide more flexibility, whereas the Apple devices are designed to be more user friendly for the non-technically oriented.
As a follow up to yesterdays report of desktop screen resolutions, today I'm presenting the latest measurements of mobile screen resolutions.
About This Data
My mobile screen resolution tracking comes from a pool of more than 100 retail jewelry websites. Most of those sites do not have a responsive website design. As you work through this, you'll realize that Apple devices dominate in the jewelry industry. I've seen more generic data from the internet as a whole that didn't reflect the Apple devices so strongly.
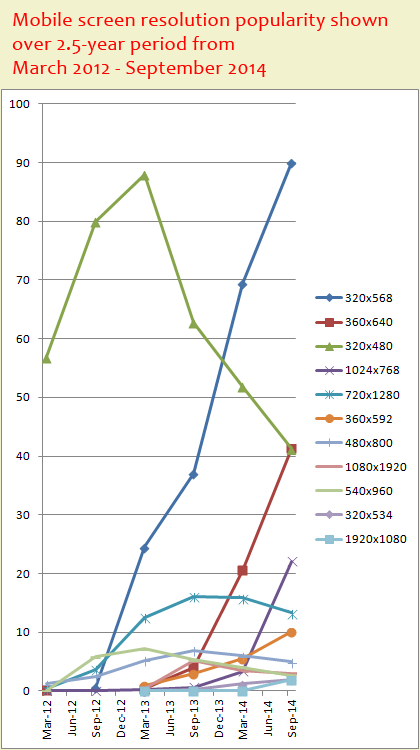
The measurement period is from March 2012 through September 2014 and this is from smartphone, or smartphone-like devices. Tablets are excluded.
Popular Mobile Resolutions

The dominating screen resolution in the above chart shows as 320x568. This is how the iPhone 5, Phone 5s, and iPhone 5C report themselves even though they are actually 640x1136 resolution. As you can see, the iPhone 5x series was a leader above Android devices within two months after released in September 2012.
The declining mobile resolution of 320x480 represents the iPhone 3, 3s, 4, and 4s.
Other than the iPhone 5x, the other hardware manufactures that are leading the way in the jewelry industry are Nokia and Sony Ericson. They manufacture smartphones with the 360x640 resolution. Considering the popularity of the Samsung line of devices, I found this to be very surprising.
Here's a tabular report of the smartphone usage recorded during September 2014:
| Screen Resolution | Operating System | Device/Manufacturer | Session % |
| 320x568 | iOS | iPhone 5x | 35.30% |
| 360x640 | Android | Nokia & Sony Ericson | 16.21% |
| 320x480 | iOS | iPhone 3x & 4x | 15.54% |
| 720x1280 | Android | Galaxy Note 2 | 5.21% |
| 1024x768 | iOS | iPad Mini | 4.47% |
| 1024x768 | Android | HTC One | 4.17% |
| 360x592 | Android | Sony, Motorola, Nexus | 3.95% |
| 480x800 | Android | Galaxy SII, SIII | 1.71% |
| 1080x1920 | Android | Galaxy Note 3, LG | 1.19% |
| 540x960 | Android | Galaxy S4 | 1.05% |
| 320x534 | Android | Galaxy S, LG | 0.76% |
| 1920x1080 | Windows | Galaxy Note 3, LG | 0.73% |
| 1366x768 | Windows | Alcatel One Touch Fire | 0.66% |
| 320x480 | Android | LG | 0.64% |
| 640x360 | Android | Galaxy S4 | 0.48% |
| 375x667 | iOS | iPhone 6 | 0.37% |
The Samsung Galaxy products appear a lot in that table, and the combined total is only 11.13% of market share. That's less than the iPhone 3 & 4.
I was a little surprised that the Google Nexus 5 smartphone didn't make a stronger appearance on the report. The Nexus 5 resolution is the same as the Galaxy Note 3, which has at most a 1.92% market share.
iPhone 6
The iPhone 6 was officially available on September 19, 2014 and appeared on my mobile popularity scale at number 16 by the end of the month.
Leaping forward another 10 days into October, I see it's already in position 8 with 1.85% of market share. I expect it will have a meteoric rise in popularity similar to the iPhone 5.
Mobile Device Conclusions
The next time you can upgrade your smartphone, you should choose one that is popular with your customers. You should be choosing from the iPhone 5, iPhone 6, Nokia Androids, or Sony Ericson Androids. This will allow you to experience mobile browsing the same way your customers see you.


