In this Daily Golden Nugget, I'm showing you the most popular desktop screen resolutions for September 2014 and spanning back 3 years.
Knowing the most popular screen resolutions is great to know if you are redesigning your website, but 'tis not the season to be launching into a redesign. My hope is that this will help you put the final touches on your holiday online marketing.
About This Data
The data presented here was tracked across more than 100 retail jewelry websites. This is completely generic data from a mix of different sites with a variety of different features. That mix of features includes jewelry product catalogs, jewelry designer line pages, e-commerce, blogs, photo galleries, and general information that all websites typically have.
Although the information below applies to the jewelry industry, I have to assume other industries would see similar results. After all, regardless what the jewelry websites look like, this is consumer information.
The measurement period is from March 2012 through September 2014. Remember that this reflects only DESKTOP SCREEN RESOLUTIONS.
Most Popular Screen Resolutions
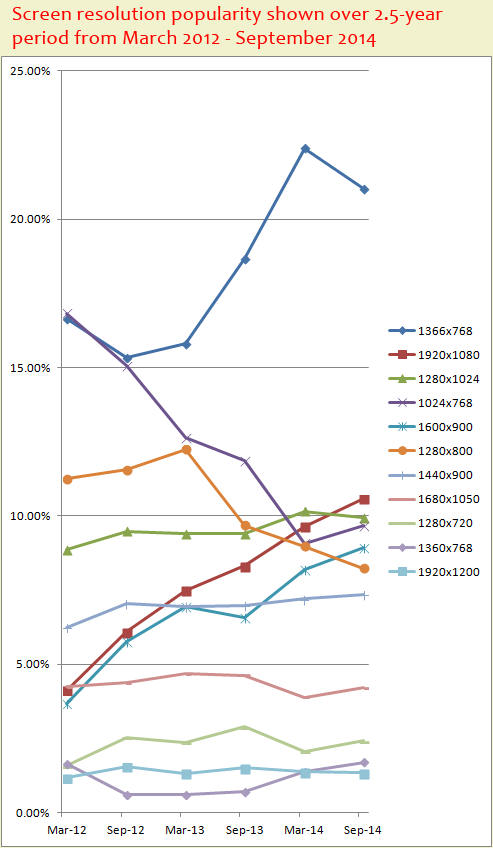
Here we see the change in popularity of the 11 most popular screen resolutions during the reporting period:

Here's the actual data:
| Screen Resolution | Sep-14 | Mar-14 | Sep-13 | Mar-13 | Sep-12 | Mar-12 |
| 1366x768 | 21.05% | 22.40% | 18.66% | 15.81% | 15.35% | 16.64% |
| 1920x1080 | 10.58% | 9.65% | 8.31% | 7.48% | 6.09% | 4.13% |
| 1280x1024 | 9.93% | 10.16% | 9.41% | 9.39% | 9.49% | 8.86% |
| 1024x768 | 9.66% | 9.08% | 11.86% | 12.63% | 15.07% | 16.83% |
| 1600x900 | 8.93% | 8.20% | 6.58% | 6.94% | 5.78% | 3.68% |
| 1280x800 | 8.24% | 8.97% | 9.68% | 12.24% | 11.55% | 11.25% |
| 1440x900 | 7.36% | 7.21% | 6.99% | 6.94% | 7.04% | 6.24% |
| 1680x1050 | 4.23% | 3.89% | 4.63% | 4.68% | 4.38% | 4.23% |
| 1280x720 | 2.42% | 2.07% | 2.89% | 2.36% | 2.54% | 1.58% |
| 1360x768 | 1.70% | 1.38% | 0.72% | 0.61% | 0.61% | 1.66% |
| 1920x1200 | 1.34% | 1.37% | 1.51% | 1.33% | 1.55% | 1.18% |
| 1536x864 | 1.23% | 1.33% | 1.33% | 1.10% | 0.73%< /td> | 0.48% |
| 1093x614 | 0.95% | 1.11% | 1.30% | 0.99% | 1.20% | 1.14% |
| 1280x768 | 0.88% | 0.83% | 0.78% | 1.31% | 1.18% | 1.69% |
| 2560x1440 | 0.79% | 0.82% | 0.95% | 0.68% | 0.55% | 0.46% |
| 1024x819 | 0.63% | 0.63% | 0.76% | 0.79% | 1.20% | 0.50% |
| 1152x864 | 0.56% | 0.63% | 1.10% | 1.25% | 1.16% | 1.24% |
| 1152x720 | 0.48% | 0.46% | 0.54% | 0.51% | 0.54% | 0.51% |
| 1024x600 | 0.41% | 0.41% | 0.60% | 0.59% | 0.98% | 1.86% |
| 800x600 | 0.40% | 0.35% | 0.43% | 0.37% | 0.79% | 0.91% |
| 1600x1200 | 0.36% | 0.33% | 0.35% | 0.31% | 0.20% | 0.30% |
| 1344x840 | 0.33% | 0.43% | 0.48% | 0.46% | 0.42% | 0.37% |
The most popular screen resolution is 1366x768. It leads by more than 10% of the second most popular screen resolution of 1920x1080.
The 1366x768 resolution is common among 15" laptop computers, and it's the official HD resolution for video.
The upward trend we see here makes a lot of sense for the past 2 years as more and more people can afford to upgrade their computers. More people are using their computers to watch movies, and they're obviously opting to choose laptops with HD video resolutions.
The 1920x1080 resolution is what you find on laptops in the 17" range. Even though there's a dip in the popularity of the 1366x768 resolutions over the last six months, the 1920x1080 resolution continues to rise.
My feeling of the 17" laptop is that it will continue to rise in popularity, but this laptop is truly a desktop replacement. I've been using a17" laptop for four years already, and I can tell you that these things are heavy, and difficult to transport. They also generate a lot of heat, resulting in shorter battery life.
I expect that we'll see an increased popularity of screen resolutions that fit into the 15" laptop category faster than the 17" category.
What does this mean to you?
First, you should upgrade your own screen resolution if you haven't done that recently. This will allow you to better understand what your customers are seeing. You should, at least, upgrade to the 1366x768 resolution.
The next thing you should consider is your website design. If you're using a responsive design you should really consider how it looks on those huge 1920x1080 screens. Many of the responsive designs I see look ugly on my 17" screen. Luckily I also have an external 1280x1024 screen attached to my laptop (doesn't everyone have an external monitor attached to their 17" laptop now?) and I prefer to look at responsive websites on that screen instead.
Where responsive designs often fail is with the size of the images. They are too big to download on a smartphone, and sometimes too small to view on the large resolutions. They become pixilated when enlarged too much.
Bounce Rate and Pages Viewed Per Session
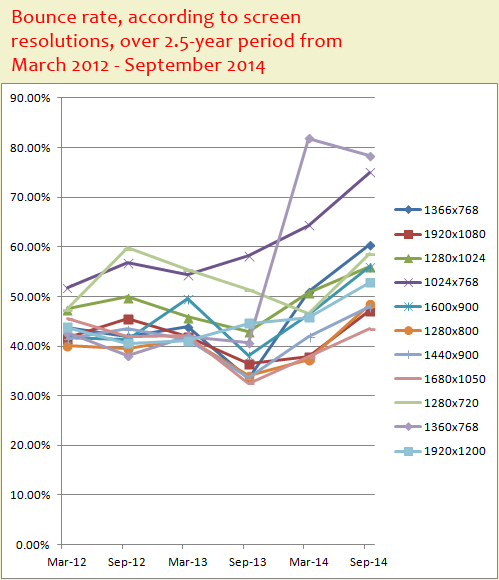
In my quest to discover some unusual tidbits of information I pulled together this first chart. It shows the bounce rate percentage over the last 2.5 years. Each line also corresponds to one of the popular screen resolutions.
Take a look:

Apparently it doesn't matter what screen resolution a person has; the bounce rate is on the rise for all of them. Although it looks like the bounce rate for the 1366x768 resolutions is rising faster than all the others.
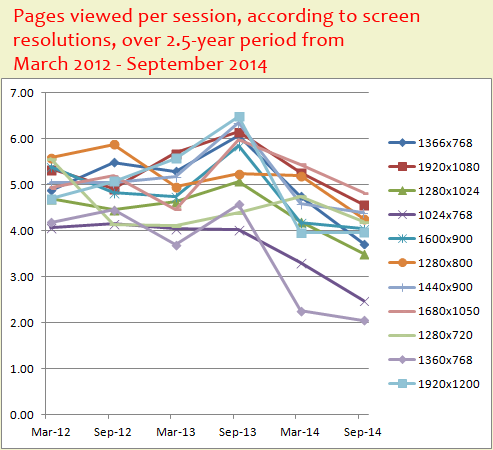
Every time I see rising bounce rates, I then switch over to see how many pages people are viewing on average when they don't bounce off the site. So this next chart shows the same 2.5 year period of the pages viewed per visit according to the screen resolutions.

Drawing Some Conclusions
I was hoping to glean something special about the most popular screen resolution from the bounce rates and pages per visit, but there's not enough data for that type of conclusion. But I realized something else instead...
The overall bounce rate is on the rise since September 2013 while the pages per visit are on the decline. This trend isn't related to screen resolutions at all, but something else. That something else is probably Google.
For those of you not following Google's ever changing algorithm on your own, you can check out the MOZ pages that tracks Google Search algorithm changes here: http://moz.com/google-algorithm-change. They keep that page updated every time there's a suspected change in Google Search.
What you'll find is that these charts started to decline as soon as Google launched their Hummingbird algorithm. Hummingbird was Google's attempt to create a new way of giving users exactly what they wanted to find, so they could spend less time looking at, or sifting through random pages on a website.
Hummingbird seems to have worked!
Bounce rates might be on the rise because people are finding their answer on the landing page, Google is suggesting. The number of pages per visit might also be on the decline because Google is leading users to a landing page that is within 1 or 2 clicks from the answer they are looking for.
Of course these suppositions don't take into account the possibility that the website visitors I'm tracking simply don't like the aesthetics of the websites. But let's assume Google's improved search results are the biggest contributing factor in the bounce rate increase and decline in the number of viewed pages.
How then do you take advantage of this?
The answer is short, but the process is long... More content creation on specific topics. You could try blogging.
TL;DR
In conclusion, for marketing and website design it's good to know that the most popular screen resolution is from 15" laptops with 1366x768. The second most popular is from 17" laptops with 1920x1080.
Today's Nugget also revealed some data showing the affects Google Hummingbird has had on bounce rates and pages per visit. Search answers are more accurate when the content on your site attracts people to exactly the answer they are looking for.


