 In today's Daily Nugget, I'll show you how to read one of the important Google Analytics reports that will help you understand how people found you during the holiday season.
 Although this Nugget can stand on its own, this is actually the next part in a longer joined series of topics to prepare online advertising content for the holiday season. Launch it, then track it. I've included links to the previous Nuggets at the end of today's newsletter.
Today I'm starting with the Google Analytics Landing Page report, so log into your GA account and navigate over to Behavior -> Site Content -> Landing Pages as shown in this screen shot:

Once you get to that report, you'll want to change the date range up at the top to October 1, 2014 through December 31, 2014, or whatever range of dates you used for your marketing this year.
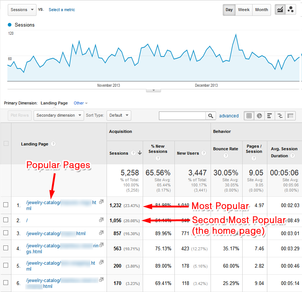
Here's what your report will look like:

(click to view larger)
The report will initially sort the columns by the most popular to the least popular. I'm only showing 6 rows in the report above, but there will be 10 on the report you see in front of you, with the option to page through many more.
The above report shows the home page as the second most popular page, and yours will probably be in the first or second position too.
I actually pulled this report from the 2013 holiday season. The top 20 pages from their report are filled with all the subsections of their product catalog. Remember that a "Landing Page" is the page someone arrives on when entering your site. Many times these landing pages are the highest ranked pages in search results, but they could also be the result of social sharing activity.
As I look at this report, I'm inclined to correlate the common activities that people have during the holiday season. Most shoppers are searching for specific products or product category types, and the search engines respond with more online catalog pages than content (i.e. blogging) pages.
You should compare the landing page information with actual sales for those products. This will be a manual process of comparing these reports to your store sales reports, or Google Analytics can do this automatically for you if you have an e-commerce site set up with the appropriate sales tracking tags.
Do your store sales match the analytics report? If not, then you should probably figure out why. Maybe you didn't have enough supply to meet the demand, or maybe the website attracted people but then they bounced away because they didn't like the site or the product selection. Understanding how this relates will help you create a better plan for the 2015 holiday season.
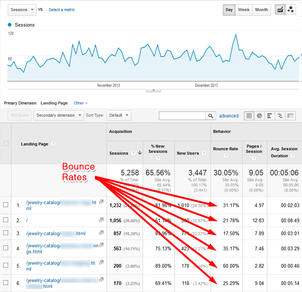
Here's another screen grab of the same chart:

(click to enlarge)
The Bounce Rate shows how many people were interested in what they saw on your website when they first arrived. Oftentimes, you will see the bounce rate is a lot lower during the holiday season than the rest of the year because people are in a "must get it now" mentality.
In the chart above, you can see a respectable 31.17% bounce rate for the most popular page and then an amazingly low 17.5% bounce rate for the third most popular page. If you have a bounce rate lower than 20, you should examine exactly how people are finding that page in organic search and what the page looks like. Learn whatever you can from that page and copy the techniques throughout your site.
Inversely, there's even more to learn when you see a high bounce rate like the 60% shown in row five. Something went wrong on that page. It could have been the keyword phrases that triggered that page to appear in search; the page layout might have looked ugly, or the page could have been broken in some way.
When you dig deeper into the landing page report, you will find the pages that you socially shared, but there's a better report for the shared likes that I'll show you in a later Nugget. For now, you should just think of this landing page report as a general snapshot of the most popular website pages during the holiday season.
Here's the links to the previously related Holiday 2014 Marketing Plan:
1. Selecting the best items for your holiday campaigns..
2. Plan your offline and email marketing.
3. Online marketing strategies.
4. Using domain names for offline tracking.
5. Tracking shared links and domains with UTM variables.


