 The big shopping dates of Black Friday and Cyber Monday have passed for the 2013 season and the mobile user numbers are in.
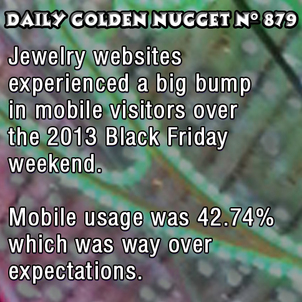
Total mobile usage is at 42.74%!!! Compare that to the 40% mobile usage I predicted back in August.
Smartphones alone account for 26.91% of that traffic and these numbers still seem to be climbing for this Holiday Season.
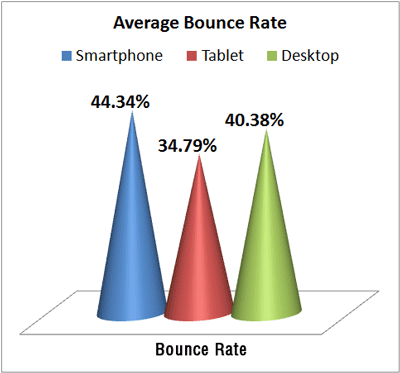
The average Bounce Rate over the 4 day period from Black Friday through Cyber Monday shows 40.56%. Remember that my tracking sample is strictly for the retail jewelry industry. This bounce rate is actually lower than the average bounce rate of 43.99% that I measured during the summer of 2013, and it's much lower than the 47.64% bounce rate from Black Friday weekend last year.
Here's the same info in list form:
40.56% Bounce Rate from 2013 Black Friday weekend
43.99% Bounce Rate from Summer 2013 (Memorial Day - Labor Day)
47.64% Bounce Rate from 2012 Black Friday weekend
That's a pretty considerable difference in my opinion, and it might be an indicator that this might really be a better season for jewelers. These bounce rates could indicate that the need for holiday shopping increases someone's willingness and patience to navigate a website. What are your thoughts?

November 29, 2013 - December 2, 2013
40.56% Average Bounce Rate Overall
44.34% Bounce Rate for Smartphone Devices
34.79% Bounce Rate for Tablet Devices
40.38% Bounce Rate for Desktop Computers
Compare this to last month:
November 1, 2013 - November 16, 2013
41.47% Average Bounce Rate Overall
46.20% Bounce Rate for Smartphone Devices
38.65% Bounce Rate for Tablet Devices
40.17% Bounce Rate for Desktop Computers
The bounce rates for mobile devices have dropped, probably because people were out shopping and needed answers. The bounce rate for desktops also went down, but not by much. My conclusion on this is that holiday related shopping searches are taking place on mobile devices right now, and in a few more days we'll see the desktop bounce rate drop a little more.
Of course the bounce rates aren't everything. Here's what their other engagement numbers look like:

November 29, 2013 - December 2, 2013
5.57 Average Pages per Visit Overall
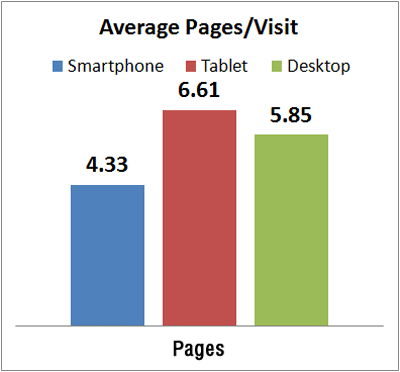
4.33 Average Pages per Visit for Smartphone Devices
6.61 Average Pages per Visit for Tablet Devices
5.85 Average Pages per Visit for Desktop Computers
Compare this to last month:
November 1, 2013 - November 16, 2013
5.12 Average Pages per Visit Overall
3.95 Average Pages per Visit for Smartphone Devices
5.93 Average Pages per Visit for Tablet Devices
5.41 Average Pages per Visit for Desktop Computers

November 29, 2013 - December 2, 2013
09:02 Average Visit Duration Overall
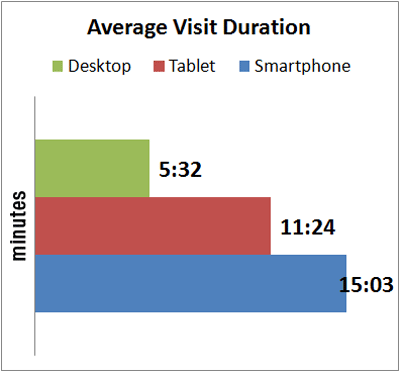
15:03 Average Visit Duration for Smartphone Devices
11:24 Average Visit Duration for Tablet Devices
5:32 Average Visit Duration for Desktop Computers
Compare this to last month:
November 1, 2013 - November 16, 2013
07:44 Average Visit Duration Overall
14:35 Average Visit Duration for Smartphone Devices
13:47 Average Visit Duration for Tablet Devices
03:48 Average Visit Duration for Desktop Computers
Drawing conclusions from these numbers
Smartphones - Take a close look at the smartphone results. The page views and average visit duration both went up a little over the weekend. I have to say that this correlates to millions of people using their smartphone while out shopping.
Tablets - Although the number of pages viewed went up, the average time on site dropped by more than 2 minutes. My conclusions on this are simply that people were in more of a rush during the weekend.
Desktops - Although the bounce rate and the average number of pages per visit didn't change much, the time on site increased by almost 2 minutes. I'm pretty sure if I dig into the data more deeply, I'll find out that people are spending more time reading pages. Have you ever wondered if long product descriptions were worth it? I certainly know that they are, but this is the time of year to test it and prove it for yourself.
I'll check in on these same numbers later this month. Stay tuned!


