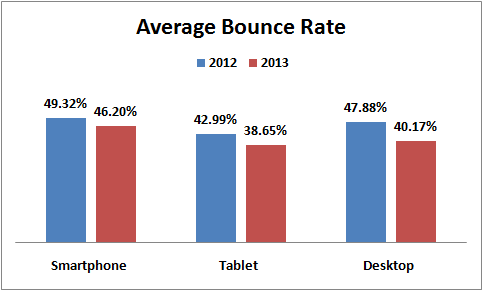
Bounce Rate for Nov 1-16
| 2012 | 2013 | Percentage Change | |
| Smartphones | 49.32% | 46.20% | Better by 6.32% |
| Tablets | 42.99% | 38.65% | Better by 10.08% |
| Desktops | 47.88% | 40.17% | Better by 16.11% |
Several of the websites in my sample set were redesigned in the last 12 months with better full and desktop versions, which would contribute to the better bounce rates from 2012 to 2013.

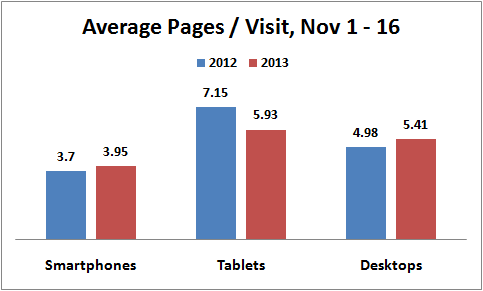
Average Pages per Visit for Nov 1-16
| 2012 | 2013 | Percentage Change | |
| Smartphones | 3.70 | 3.95 | Better by 6.76% |
| Tablets | 7.15 | 5.93 | Worse by 17.03% |
| Desktops | 4.98 | 5.41 | Better by 8.81% |
Website redesigns might also account for the 17% decrease in the pages viewed by tablet users. Over the last 12 months, there's been a trend to design websites with dropdown menus which notoriously malfunction on tablets. Perhaps tablet users want to spend more time, but they simply can't navigate the site.

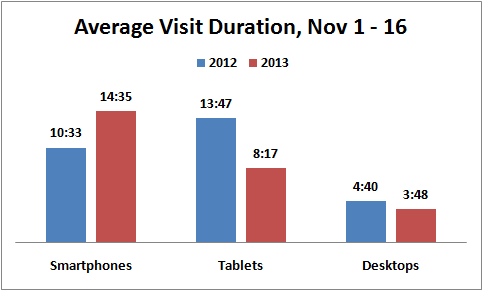
Average Visit Duration for Nov 1-16
| 2012 | 2013 | Percentage Change | |
| Smartphones | 10:33 | 14:35 | Better by 38.25% |
| Tablets | 13:47 | 08:17 | Better by 66.42% |
| Desktops | 04:40 | 03:48 | Worse by 18.61% |
I'd like to think that the visitor duration is increasing on mobile devices because more people are using them and they are willing to stay longer. I could argue that the drop in average visitor duration for the desktop is both bad and good.
If I drill down deeper into my numbers and assume, I would find that redesigned websites had helped users find what they were looking for faster, and therefore they needed to click through fewer pages. I also have to assume that I'd find websites that were not redesigned with fewer engagements.
I think these numbers deserve much deeper analysis to find some true "nuggets."

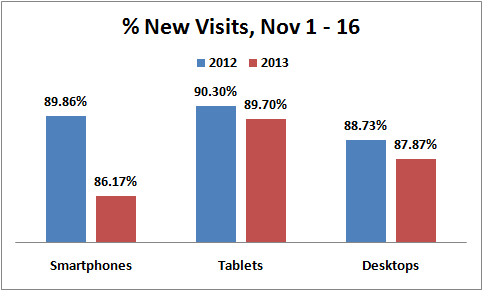
% New Visits for Nov 1-16
| 2012 | 2013 | Percentage Change | |
| Smartphones | 89.86% | 86.17% | Worse by 4.11% |
| Tablets | 90.30% | 89.70% | Worse by 0.66% |
| Desktops | 88.73% | 87.87% | Worse by 0.97% |
This last table of numbers is very interesting and very confusing at the same time.
A lot of different factors play into why these numbers show a drop. It could be that the changes in Google ranking methods are ranking my sample websites lower; or it could be that the competition for the jewelers I'm tracking have improved their ranking.
There were a few forecast that this 2013 holiday season would be bleak. Of course, this drop could be an early warning that those forecasts are true.
We have to wait until the end of the season to find out the real numbers; in the mean time I'll check back in on these again in a few weeks.
In the mean time, what's your take? I'd like to hear your opinion.


