Total mobile usage is at 37.36%. Compare that to the 35.85% mobile usage I reported for July-August 2013.
Smartphones alone account for 24.77% of that traffic and these numbers are on the rise as expected for the Holiday Season.
Websites that are not equipped to handle smartphones create a lower level of customer satisfaction. Even though you might have a mobile optimized site, it might not actually be working correctly according to Google's standards. Google maintains a list of common mobile programming mistakes that cause customer dissatisfaction. Here are some of their highlights from their list:
* Don't automatically redirect people to the mobile version of your website unless you are sending them to the page with the same content as the page they would be viewing on a desktop. In other words, redirect the desktop version of the Contact Us page to the mobile version of the Contact Us page; and redirect the desktop version of your product catalog to the mobile version of your product catalog.
* Don't force mobile users back to your mobile website if they are specifically requesting to view the full version of your site.
* Optimize your content for mobile users. Your rendering time for mobile sites should be under 1 second per page. This is oftentimes not possible if you are using a responsive website design like the one I reviewed here back in August 2013.
These 3 factors will play a big part in how website visitors use your site, and if they stay long.
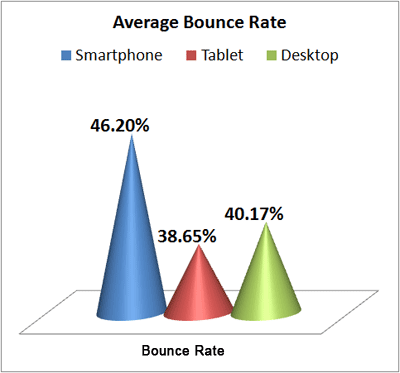
The average Bounce Rate for the jewelry websites in my tracking sample is 41.47%; many of the sites I track are not optimized for mobile. The customer dissatisfaction is apparent in the bounce rates shown below.

November 1, 2013 - November 16, 2013
41.47% Average Bounce Rate Overall
46.20% Bounce Rate for Smartphone Devices
38.65% Bounce Rate for Tablet Devices
40.17% Bounce Rate for Desktop Computers
The lower bounce rate for the tablet user shows that they more patient users, whereas the smartphones users are clearly impatient.
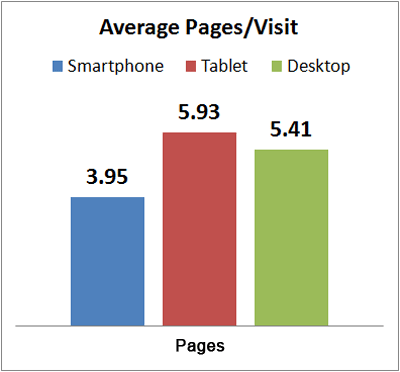
Of course the bounce rates aren't everything. Here's what their other engagement numbers look like:

November 1, 2013 - November 16, 2013
5.12 Average Pages per Visit Overall
3.95 Average Pages per Visit for Smartphone Devices
5.93 Average Pages per Visit for Tablet Devices
5.41 Average Pages per Visit for Desktop Computers

November 1, 2013 - November 16, 2013
07:44 Average Visit Duration Overall
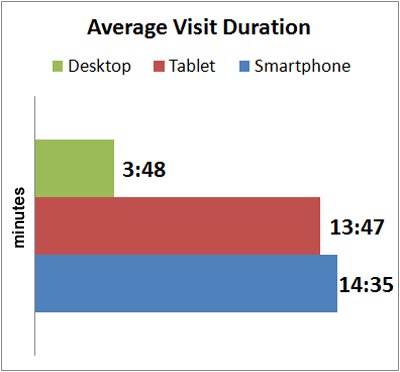
14:35 Average Visit Duration for Smartphone Devices
13:47 Average Visit Duration for Tablet Devices
03:48 Average Visit Duration for Desktop Computers
Drawing conclusions from these numbers
Smartphones - These users have less patience and are unwilling to deal with mobile incompatibility or speed issues. But if you have what they need, they certainly will stay committed for about 15 minutes.
Tablets - These users are more willing to look deeper into a website rather than bounce away. Since tablets usually render the desktop version of a website, these users are probably not dealing with incompatibility issues. They stay for almost 14 minutes if you have what they're looking for.
Desktops - Think of your visitor engagements from desktop computers as your benchmark values. Smartphone have a higher bounce rate, but tablets have a lower. Desktop users will give you about 4 minutes of their time before they move on to something, or someone else. Naturally desktop users have faster internet connections and easier time navigating so they can consume more pages in 4 minutes than what the mobile devices could do in 14 minutes.
I'll check in on these same numbers later in this holiday season and again after it's over. These numbers should help to convince jewelry store owners that mobile websites are necessary.


