
 Do you wonder where your next customer will come from? Without any special work, Google Analytics can tell you where your visitors are coming from.
Here's how it works...
Log into your Google Analytics account and, on the left side, navigate your way over to:
Audience -> Geo -> Location
On this page, you'll see the world map shown in various shades of blue to represent the number of people who have visited your site.
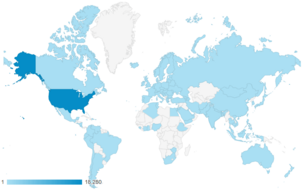 The darker blue represents more people. To see people in your local area you simply need to click on your country, then state or province.
 As you drill down into the map, the table of data below it will change. You can't zoom the map close enough to see individual towns, but you can see the list of towns in the table below the map.
By default this map view shows the number of "Visits" you had to your website. At the top left corner of the map area you'll notice a button that says "Visits."
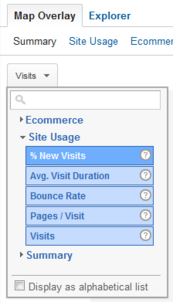 Click that button to reveal a dropdown where you can choose different menu viewing options. Test that feature out by selecting the "% New Visits" option.
The "% New Visits" map view should show several dark blue circles representing were customers are coming from. Take a good look at it and try to figure out if there are more dark blue circles in one area than another. That represents where your new customers are coming from.
The table below the map will have all the numerical data that's represented as circles on the map.
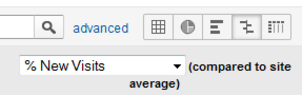 Next you need to click on the drop down menu to change the comparison metric to "% New Visits" so we can answer the question at the top of this Nugget. You should see a bunch of green bars and red bars. The green bars represent the towns were new customers are coming from while the red bars represent towns where existing customer are coming from.
Once again I want you to ponder what you're looking at... Exactly why are new customers finding you from those towns? Do you have online ads in those areas? Do you have offline ads in those areas? Did you mention those town names on your website somewhere?
There is a reason that people from these towns are finding you, and that might not be simply organic traffic online. Can we figure out what it is though?
 We can try...
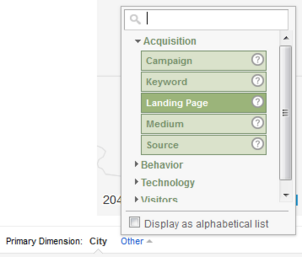
Click on one of the town names, then click on the word Other where it says "Primary Dimension: City Other" to reveal another dropdown menu, in which you need to select Acquisition -> Landing Page.
The table will reformat itself and show the actual landing pages those people arrived at. But we're not done just yet. There's one more setting I want you to look at...
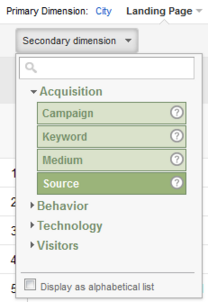 Click on the button for "Secondary dimension" to once again reveal the dropdown menu. In there click Acquisition -> Source.
If you've followed all the steps to this point you will have a table with these columns:
Landing Page
Source
Visits
% New Visits

The rows with green bars represent your new visitors. The Source shows how they found you. Google? Yahoo? Direct?
All the rows that show your home page (usually shown as a / ) and the source as "(direct)" usually represent people who saw your offline advertising and typed in your website directly.
Studying this table will give you some insights into what the people around you are looking for and how they found your website. Once you really start working through this town data, you should also recognize Landing Pages that you share to Facebook or Google+ and how those shares drove traffic to your site.
What's the final outcome of all this? You can use this reporting to figure out where to adjust your ad spending and town targeting. No need to continue to spend money on advertising if it's not bringing visitors to your website.

